Schedule for week 7
It seems the contents in weeks 5 and 6 are too heavy. I’ll make this week a little more relaxing and fun.
Homework
-
Read in the COVID-19 data, provide R codes and results for the following questions:
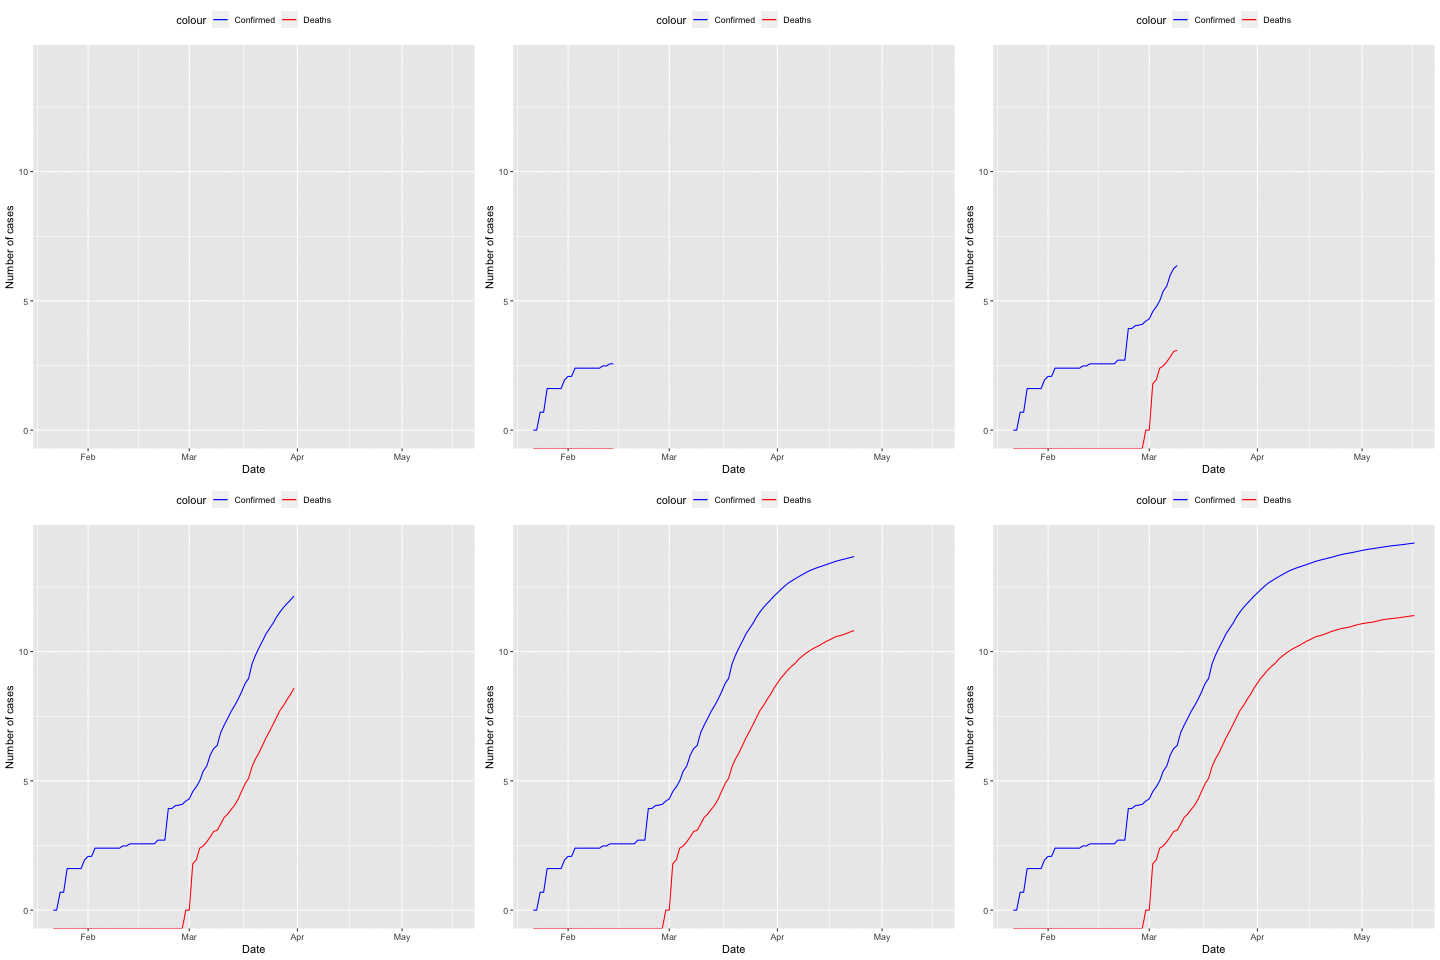
- Generate an animated figure to show the total number of confirmed and death cases in the US by date. I expect to see a figure similar to the following:

- Do the same (animated figure) for daily new confirmed and death cases in the US.
Day 1 and 2: R animation
Learn how to generate animation in R graphics. Let me know if this is difficult.
- https://www.listendata.com/2019/05/create-animation-in-r-learn-with.html.
- https://www.datanovia.com/en/blog/gganimate-how-to-create-plots-with-beautiful-animation-in-r/.
- Do homework question 1.
Day 3:
Review the content in week 4. Pay more attention to the R base graphics content. Review the homework. Redo homework questions 6 and 7. Note: don’t copy your old codes. Be honest to yourself. See if you can do these homework questions faster than first time.
Day 4:
Review the content in week 5. Pay more attention to the R function content. Redo homework questions 4 and 5.
Day 5:
Review the content in week 6. Pay more attention to the Linux commands. Redo homework questions 1 and 2.