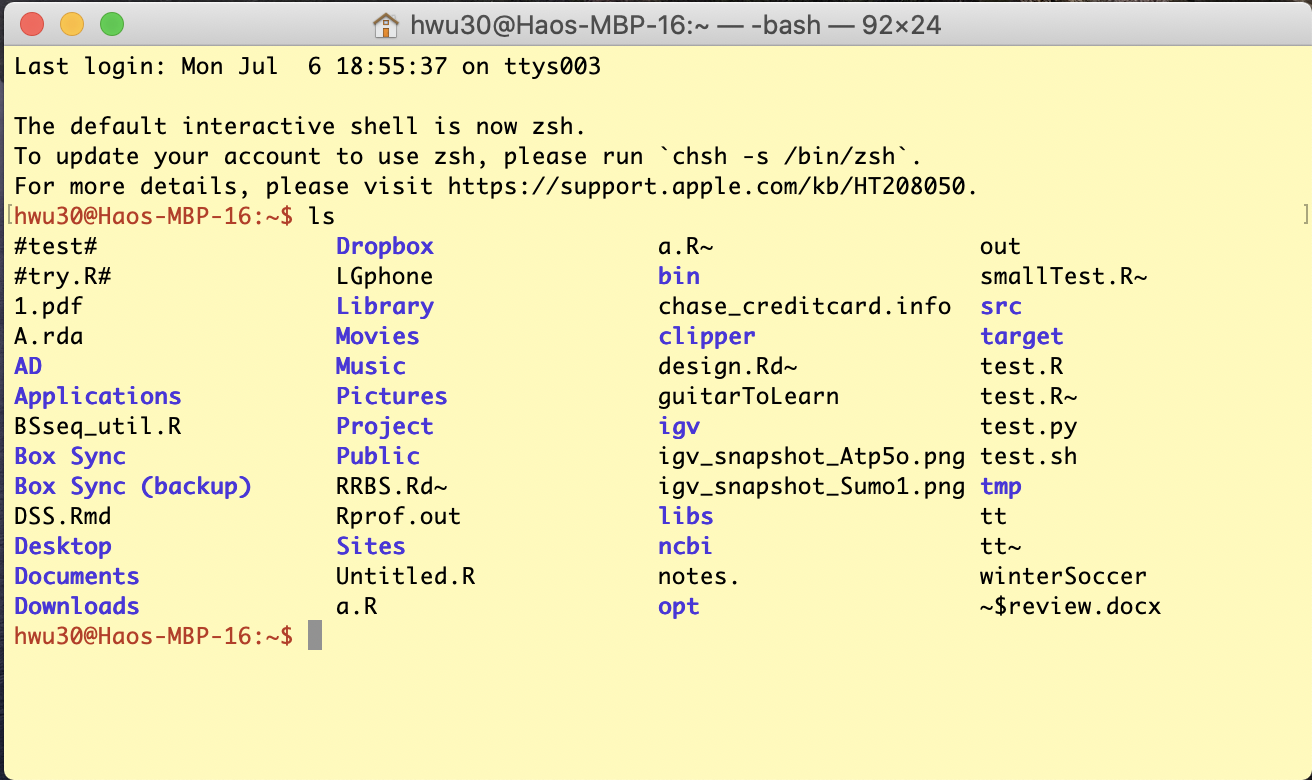
Basic Linux command and operation. Perform following operations (all using Linux command in the Linux shell), answer questions and provide Linux commands used for these operations.
When you start the Linux shell window, how to get the current directory (provide the Linux command used)?
Create a folder at your root directory, provide the command.
Change directory to the folder you just created. Provide the command.
You have downloaded the COVID-19 file in Week 2. If you can’t find it, download again. Copy the COVID-19 file to the folder you just created in Linux. Provide the Linux command for that. For Windows user: I’m not sure how the the file system works for WSL. You can try the following command to download the file in Linux. If it doesn’t work, talk to me and we’ll figure out.
wget http://www.haowulab.org/DataSummerCamp/data/covid_19_clean_complete.csvHow many lines, words, and bytes are there for the COVID-19 file? Provide the command.
Look at the first 10 lines of the COVID-19 file in the Linux shell. Provide the command.
Look at the bottom 10 lines of the COVID-19 file in the Linux shell. Provide the command.
Show the disk usage on your system available. Show the command and the results.
Show the disk usage of the folder you just created. Show the command and the results.
More advanced Linux command and operation. Perform following operations (all using Linux command in the Linux shell), answer questions and provide Linux commands used for these operations.
- Go to the folder you had for other homeworks.
- Provide a command to list all the Rmarkdown files.
- Provide a command to list all the Rmarkdown files, with detailed information (size, date, etc.), sort the files by date.
- Provide a command to list all the Rmarkdown files, with detailed information (size, date, etc.), sort the files by file size.
- Provide a command to list all files with file names starting with “homework”.
- Provide a command to list all files with file names containing “homework”.
- Provide a command to list all the Rmarkdown files, with detailed
information (size, date, etc.), sort the files by date, and redirect the
list to another file named
allRmd. Show theallRmdfile.
- In the COVID-19 data file
(
covid_19_clean_complete.csv), provide commands for the following:- Provide one line command to take out the lines contain string
“
China” and output to another file. Hint: usegrepwith file piping and redirection. - Provide one line command to get the number of lines in the file
contain string “
China”. Hint: use a combination ofgrepandwc. - Do the above two tasks in R. Provide the R codes.
- Provide one line command to take out the lines contain string
“
Read in the COVID-19 data, provide R codes and results for the following questions:
What is the range of date for the data?
How many days are there in the data?
Take the data for US only, and plot the number of confirmed and death cases along the date. Generate two panels in the same figure, one uses original scale and one uses logrithm scale for the number of cases. Use proper axis labels and legends. I expect to see a figure similar to the following. Hint 1: use the
matplotfunction. Hint 2: look at thelogparameters inplotfunction to plot data in logrithm scale.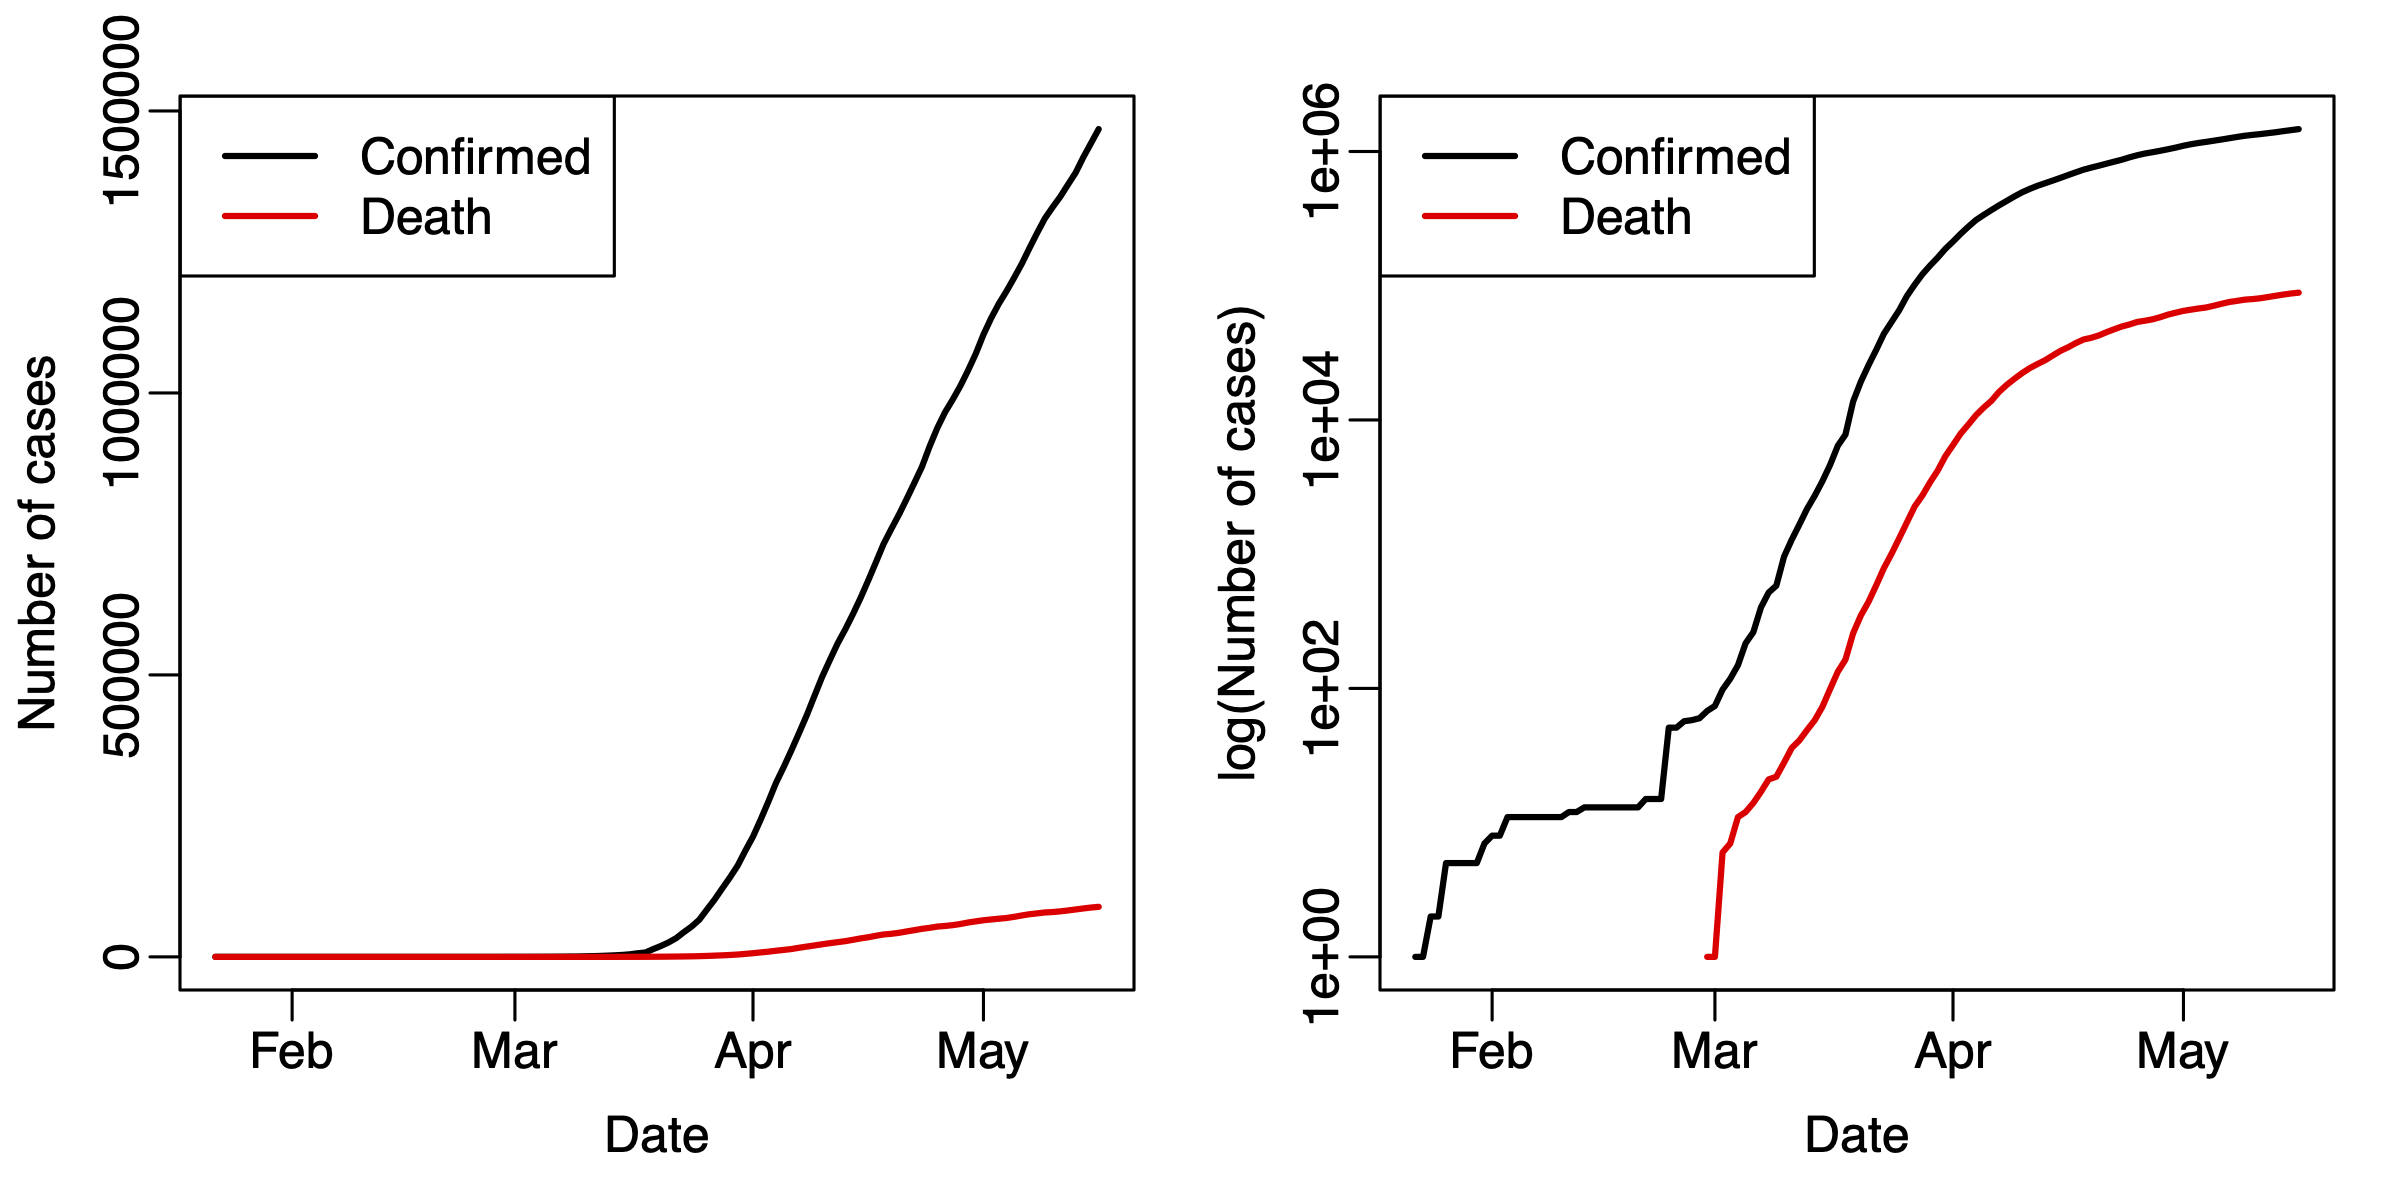
Take the data for the US, compute the numbers for new confirmed and death cases for each day (using the
difffunction). Visualize the results in a figure similar to the above.
Here is a set of homework for the R programming class at Emory University. Do the questions as much as you can.