Create a Latex file homework3.tex:
Make a latex document with subsections and subsection. Put in some random text.
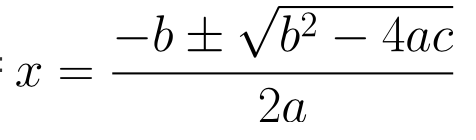
Type up the following equations in the tex file:
Create an R markdown file homework3.Rmd, and answer following questions. Pay attention to the format.
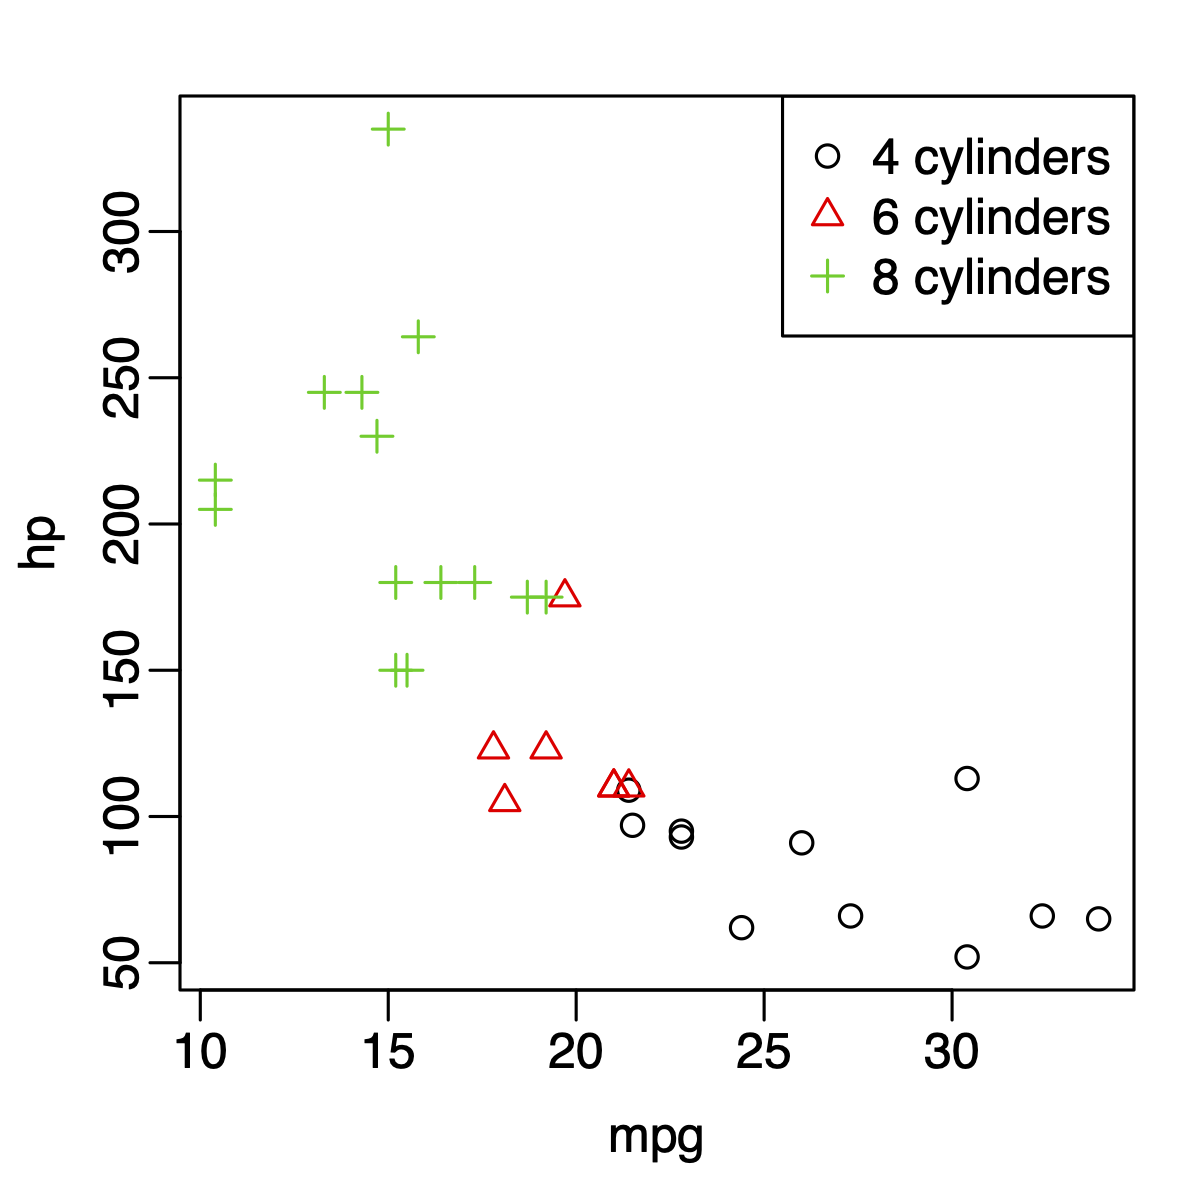
Make scatterplot between mpg and horsepowers for
mtcarsdata, using theplotfunction. For the figure, please:- Use different colors and point types for cars with differnt number of cylinders.
- Add a legend to indicate the meaning of the point type/color.
Hint:
- check the
type="n"option in theplotfunction, and thepointsfunction. - For the
legendfunction, I used"topright"as location instead of giving the x and y coordinates. I think it’s easier. You can try other similar options, such as"bottomleft".
I expect to see a figure similar to the following:
Create a random matrix with 3 rows and 4 columns.
- Compute the sum and mean of each row and each column, using loop.
- Check out the following functions:
rowMeans,colMeans,rowSums,colSums. Use these functions to repeat the above calculation.
For the
mtcarsdata,- compute the average horse power for cars with 6 cylinders, using
loop and
if-else. Can you do this more efficiently (with fewer lines code)? - compute the average mpg for cars with horse power greater less than
120, between 120 and 200, and greater than 200, using loop and
if-else. Again, can you do this more efficiently?
- compute the average horse power for cars with 6 cylinders, using
loop and
Include the equation required for homework3.tex in homework3.Rmd.
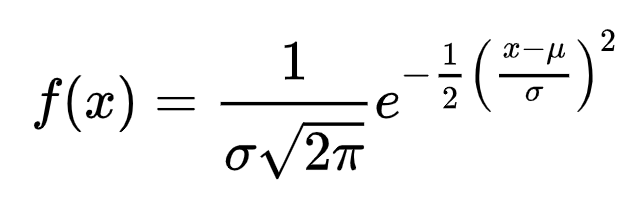
Type up the distribution density function for normal distribution (the oft-seen bell-shaped curve) in homework3.Rmd. The density function is
Create an example.Rmd to reproduce everything in http://www.math.mcgill.ca/yyang/regression/RMarkdown/example.html, follow the same style. You can just copy/paste the text so that you don’t have to retype them. What you need to do is to correctly format it.