Schedule for week 3
Homework
- Create a Latex file homework3.tex:
- Make a latex document with subsections and subsection. Put in some random text.
-
Type up the following equations in the tex file:
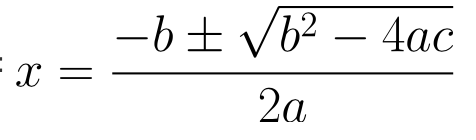
-
Create an R markdown file homework3.Rmd, and answer following questions. Pay attention to the format.
- Make scatterplot between mpg and horsepowers for
mtcarsdata, using theplotfunction. For the figure, please:- Use different colors and point types for cars with differnt number of cylinders.
- Add a legend to indicate the meaning of the point type/color.
Hint:
- check the
type="n"option in theplotfunction, and thepointsfunction. - For the
legendfunction, I used"topright"as location instead of giving the x and y coordinates. I think it’s easier. You can try other similar options, such as"bottomleft".
I expect to see a figure similar to the following:
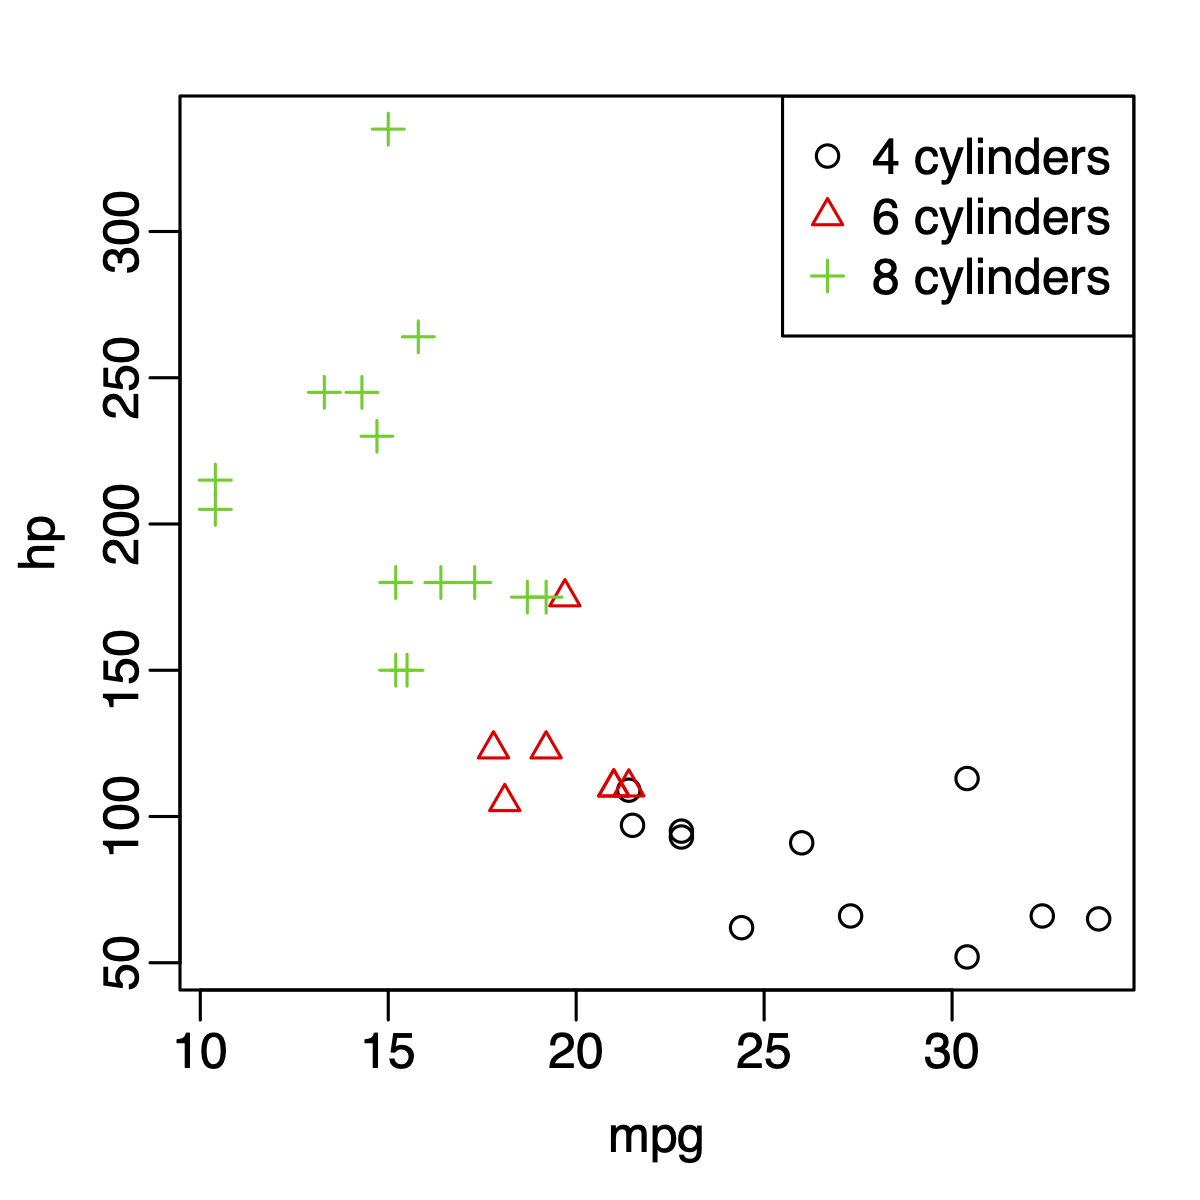
-
Create a random matrix with 3 rows and 4 columns. - Compute the sum and mean of each row and each column, using loop. - Check out the following functions:
rowMeans,colMeans,rowSums,colSums. Use these functions to repeat the above calculation. - For the
mtcarsdata,- compute the average horse power for cars with 6 cylinders, using loop and
if-else. Can you do this more efficiently (with fewer lines code)? - compute the average mpg for cars with horse power greater less than 120, between 120 and 200, and greater than 200, using loop and
if-else. Again, can you do this more efficiently?
- compute the average horse power for cars with 6 cylinders, using loop and
-
Include the equation required for homework3.tex in homework3.Rmd.
-
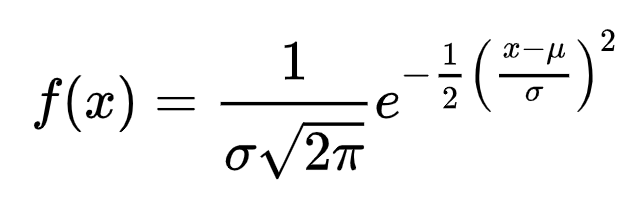
Type up the distribution density function for normal distribution (the oft-seen bell-shaped curve) in homework3.Rmd. The density function is
- Make scatterplot between mpg and horsepowers for
- Create an example.Rmd to reproduce everything in http://www.math.mcgill.ca/yyang/regression/RMarkdown/example.html, follow the same style. You can just copy/paste the text so that you don’t have to retype them. What you need to do is to correctly format it.
Day 1: Review on file I/O, data frame, list, and R base graphics
- Reread https://www.guru99.com/r-import-data.html, https://www.guru99.com/r-data-frames.html, and https://www.guru99.com/r-lists-create-select.html.
- Review the functions for histogram, boxplot, scatter plot, bar plot.
- Learn how to add figure legends in the R base graphics: http://www.sthda.com/english/wiki/add-legends-to-plots-in-r-software-the-easiest-way.
- Do homework question 1.
Day 2: R control statement
- Read https://www.guru99.com/r-if-else-elif-statement.html
- Read https://www.guru99.com/r-for-loop.html.
- Read https://www.guru99.com/r-while-loop.html.
- Do questions 2-3 in homework.
Day 3: Basic Latex
- Read https://www.latex-tutorial.com/tutorials/, up to
04 Math. - Follow the instructions to install the Latex system.
- Work on homework3.tex.
Day 4: R markdown
You have learned some R, some markdown, and some Latex. Now it’s time to put them together. From now on, I want a homework submitted in Rmarkdown format, so that the text and R code will be blended together.
- Read https://rmarkdown.rstudio.com/authoring_quick_tour.html. Since you already know markdown syntax, pay special attention to the parts to include R codes with markdown.
- Learn to include equations in Rmarkdown. The equation syntax is exactly the same as in Latex: https://www.calvin.edu/~rpruim/courses/s341/S17/from-class/MathinRmd.html.
- Work on example.Rmd as listed in the homework.
Day 5: More latex and Rmarkdown
- Latex math is powerfull. I am still learning it. Read https://en.wikibooks.org/wiki/LaTeX/Mathematics. This is pretty long and comprehensive. Just read through it to get a taste of what Latex can do.
- Review Rmarkdown, read http://www.math.mcgill.ca/yyang/regression/RMarkdown/example.html.
- Work on homework questions 4-5.